
Introduction
The main purpose of this project began with the photographic aspect from high altitudes using a weather balloon. High-altitude balloons are unmanned balloons filled with helium or hydrogen launched to reach the stratosphere. However, as the project grew larger and larger, the whole purpose became to capture photographs from the flight of a weather balloon which will reach an approximate altitude over 100,000 feet or more than 20 miles, and to track and retrieve said balloon using radio-transmitted location data.
Although relatively similar to the initial intent, it was realized that the location of this balloon would be crucial to obtaining its information. As a result, the main focus of the project had a sort of shift to this aspect.
Given the right preparations and conditions, this weather balloon should take a number of pictures during its flight, all while transmitting its location to a station on the ground, which will then process the data into a readable format so that it can be used to sketch the balloon’s approximate path using the habhub tracker and Google Earth and locate its landing position. On top of receiving its location during the flight, predictions will need to be made before-hand in order to ensure an optimal retrieval location.
In terms of engineering, the Raspberry Pi computer plays a crucial role in the fields of both science and technology, allowing full-scale Linux computing to be executed on a low-power, extremely portable, and vastly versatile level. In short, the Raspberry Pi is essentially comprised of the core elements of any computer. On top of this, however, the Raspberry Pi provides the capability for custom circuits to be designed for use with its operating system, programming languages, and other specialized software.
One specific add-on board used is the Pi in the Sky telemetry board, created by Dave Akerman, a high altitude balloon enthusiast from the UK. This board is used for the sole purpose of recording and transmitting data pertaining to the balloon’s location, photographic transmission, internal temperature, and other standard weather balloon telemetry. The data that is received from this board is used to plot its path via an outboard GPS antenna.
In order to process the data received in this transmission, the habhub.org tracker tool is instrumental in providing this functionality. This utility facilitates and automates a number of elements in the high altitude ballooning process, including map plotting, data logging, and collaboration with other HAB radio reception stations.
Before this data can be processed by habhub.org, however, it is necessary to receive the raw radio data. To accomplish this, a rather heavy-duty antenna will need to be constructed, as the balloon will be approximately 20 miles away, high in the atmosphere. Many tools and resources are available in order to design an antenna with this amount of reach, such as the QuickYagi program for DOS, which helps automate this process. To put the antenna developed to use, a Software Defined Radio will be used in combination with a USB receiver dongle, the FUNcube Dongle Pro+ in this case, in order to tune into and interpret the correct radio frequencies and convert them into a format readable by other software.
The software in question here would be dl-fldigi, which allows the data output by SDR# to be translated into text. This text is then read and processed into either a point of location or a photograph, which is then send to the habhub.org tracker mentioned earlier for logging and plotting.
Materials
- Raspberry Pi (1) Model B
- The Raspberry Pi is a full-blown $35 computer with low-power requirements and a functionally diverse feature-set. This board will be the core of the balloon’s payload and will be used to operate virtually all in-air tasks.
- Pi in the Sky telemetry kit
- This kit provides a circuit board which attaches to the Raspberry Pi, providing it with the functionality need to transmit radio signals on the 434mhz band and receive its GPS location. It also provides a simple way to attach a 4x AA battery pack to power the entire unit.
- Raspberry Pi Camera
- Attaches to the Raspberry Pi to take pictures. The name says it all.
- 16GB SD card
- Used to store everything for the unit, including the OS, software, and photographs.
- 8’ Diameter Latex Weather Balloon (Burst Altitude 12’4”, 300 grams)
- The balloon that carries everything. The burst altitude and weight are crucial in calculating a prediction for where everything will travel.
- 5ft Weather Balloon Payload Parachute
- Allows the payload to float down to the ground more safely.
- FUNcube Dongle Pro+
- USB receiver connected to the laptop used in the latest test.
- NooElec NESDR Mini RTL2832U & R820T
- Not used in the final build, but was useful for reception testing. Essentially plays the same role as the FUNcube dongle, but with worse reception.
- Homemade Yagi antenna
- Used to receive the radio waves more effectively. Its construction will be described later on.
- HABAmp 434Mhz/70cms Filter & Preamp
- Used to amplify the signal coming from the Yagi antenna.
- Laptop with…
- SDR# (Software Defined Receiver Sharp)
- Used to convert the raw data from the receiver into an audio signal that can be easily manipulated and read by other software.
- VB-Audio Cable
- Used to pipe the audio generated by SDR# to dl-fldigi.
- dl-fldigi
- Used to process audio from VB-Audio Cable into a readable format and send the data to an online tracker.
- Minor (not sure if should keep)
- Monitor/TV (Composite or HDMI)
- USB keyboard
- Ethernet cable
- SDHC card reader
- SDR# (Software Defined Receiver Sharp)
Methods: Research
Several high altitude ballooning projects have been accomplished in many areas of the world. One enthusiast in the U.K., Dave Akerman, has run a number of successful flights in the past, and still continues to run them today. He is the primary developer of the Pi in the Sky telemetry board. The best, and most documented example I’ve found on his website of a flight is his PIE6 flight, which used the Pi (albeit, without his signature board) for the payload. This example has documentation of the predicted path, the balloon’s actual route, and quite an abundance of photos showing what the expected results should be. The Google Earth path for this flight provided an excellent example of what to expect from our own tests, and set the bar for what we needed to reach:
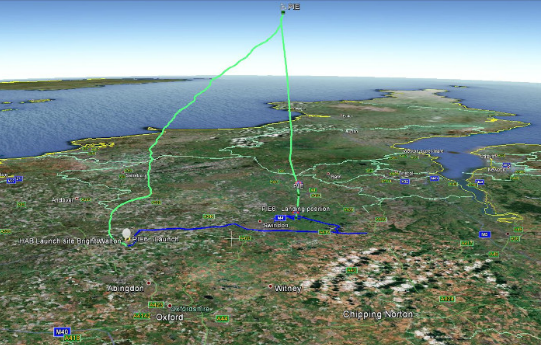
Figure 1: Actual flight path of the PIE6 high altitude balloon.
Searching around a bit more for Dave’s name across the Internet, what was found was his Pi in the Sky add-on board, which facilitated many of the requirements of this project, both in hardware and in software, as well as for capturing and transmitting the data needed to locate the payload.
The board’s website also had a great amount of step-by-step documentation as well, so it was only a matter of careful reading to understand what I had to do. I already had quite a bit of experience with the Pi itself, so that area needed not be investigated.
Had I looked into it again, however, the official Raspberry Pi website provides more than enough information needed to get the base unit up and running. After investigating the PITS website, many times I was lead to a site named the UKHAS wiki. This site details everything the PITS website does not, including the specifications required for our balloon, which receiver which should invest in receiving, the type of antenna which should be researched to build, and the software required to properly decode our transmitted information. These websites were instrumental in getting this project fully working, and are now the foundation for entire project.
While looking around for a 434mhz Yagi antenna design, we discovered a program specifically designed for that purpose: QuickYagi. Although the software is extremely old (developed in 1997), it still works fine with a bit of tweaking. After examining the structure of this type of antenna through a few visual sources, the measurements provided in this software became incredibly useful in the formation of our antenna.
Methods: Development
After ordering most of the equipment, the Pi needed to have an operating system installed and set up in order to record and transmit the necessary data. The physical assembly was relatively simple: attach the PITS board and the necessary modules and it was good to go.
For the operating system, Raspbian, a specialized version of Linux made for the Pi, was installed, as it was the most supported, both for this purpose and in general. As stated, the PITS website has great step-by-step instructions for configuring the Pi itself, so that aspect wasn’t really an issue.
The only real decision we needed to make at that point was our payload name, which ended up being “BCSDPI”. This payload name becomes crucial when interacting with habhub and dl-fldigi, so it helps to make it something easy to remember and specific to the project. Moving over to the receiving end of things, I gathered the software necessary for receiving and decoding the information sent by the Pi.
The software in discussion here will be SDR#, VB-Audio Cable, and dl-fldigi, in that order. SDR#, in a nutshell, takes a signal given by a radio receiver and converts it into an audio signal which is readable by other software. This program is also facilitates many other crucial aspects of radio manipulation, including bandwidth adjustment, frequency tuning, and a visual representation of the waves. All of these functions greatly streamline the process and make things relatively easy. Although SDR# does allow for the data to be output in an audio wave, there isn’t really any direct method to pipe the audio to other software.
This is where VB-Audio Cable comes in. This software installs a fake microphone and speaker on the computer, with the speaker receiving input from SDR# and relaying it to the fake microphone, which is then picked up by the next pieced of software: dl-fldigi. Dl-fldigi facilitates every aspect of the reception process that SDR# does not: decoding the data into text and images and uploading the information to a server for easy (and sometimes collaborative) tracking. This piece of software tends to be quite picky with which settings you provide it, but the PITS website once again helps greatly in figuring out the proper steps. The exact settings needed for the software are provided, and after a bit of fidgeting, GPS and photographic data comes flying in. At this point, it was time to take the project to the testing level.
Methods: Procedure
Using the cheap NooElec we got going into this project, I did a bit of field testing with how good of reception I could get with a bit of range. After setting all the necessary software and hardware up to a laptop, I took the computer outside while leaving the transmitter inside my house. The results were much less than exceptional; as soon as I stepped out of the door, virtually all signal strength vanished. Clearly, I was doing something incorrectly, and it was back to the drawing board. As it turns out, you get what you pay for with receivers, with the cheap NooElec dongle being labeled online as not even close to sufficient for this purpose. Digging around a bit more, it was found that we would need a much better antenna and receiver, along with a signal amplifier to get any good results. After ordering the necessary equipment once more, it was time to assemble a Yagi antenna. As described earlier in the Research section, the QuickYagi software, although old, provided great measurements for building a homemade antenna. Below is a diagram showing the exact measurements used to create the entire build.
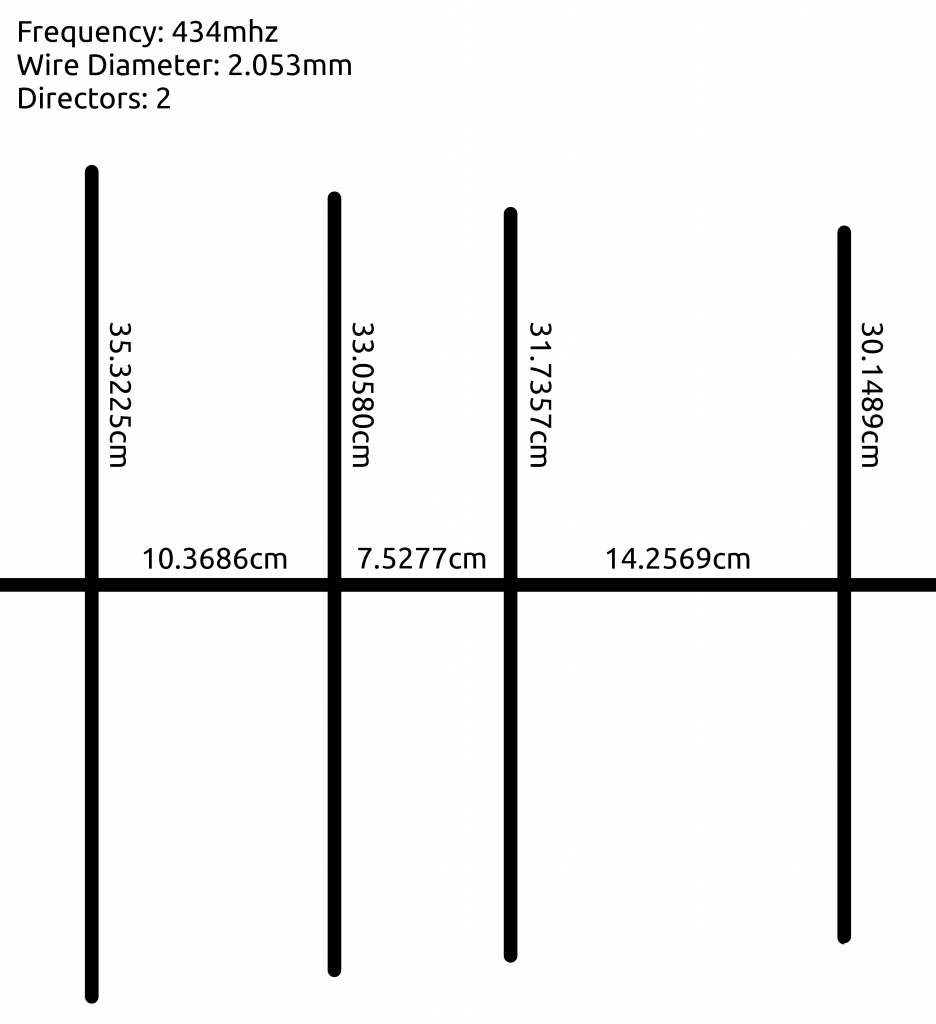
Figure 2: Schematic drawing of the Yagi antenna used to receive GPS location and photographic data from the Eagle Pride in the Sky module.
The extending sections represent pieces of wire which capture the wave, with the middle section representing the, in our case wooden, base. Once this was done, it was just a matter of soldering on an SDA cable to the driven element (second piece of wire going from left to right), and the antenna was basically ready. At this point, the only component to replace was the dongle itself. I spent some time looking into more expensive radio receivers, but came up short on anything that didn’t cost an exorbitant amount of money. In the end, I ended up finding a decent deal on the FUNcube Dongle Pro+, which is listed on the UKHAS wiki as suitable for this purpose.
Although it may have been a bit overboard, we also invested in a HABAmp 434Mhz/70cms Filter & Preamp, which essentially cleans and amplifies the signal we will be receiving at the specific frequency we are using: 434mhz. Putting all of this together, it was time to retry the test that so miserably failed before. Setting the Pi by an open window and getting the laptop ready once more, I took to the road to see what kind of distance I could get. At a little over half a mile of distance, the signal almost completely died out. While it definitely will need to be improved for a full-scale flight, this distance will be perfectly fine for a test flight. It should also be noted the amount of physical interference between my two test points, as there was quite an abundance of forestry and houses between the receiver and transmitter.
At this point, it was time to move past the hardware-testing phase and actually attempt a real test flight. Putting together all the resources we had, we moved to an open area behind the school and prepared the balloon and payload to be launched. At the bottom of the assembly was the payload itself: a Styrofoam sphere acting as the outside casing, the inside filled with softer foam acting as insulation and cushioning the fragile components. A hole was cut out of the case in order for the camera to peek through, giving it the line of sight to get the shots it needs. Through the center of the case was driven a metal rod, clamping the two hemispheres together using nuts and washers and allowing for easy attachment of this section to the second part of the entire assembly: the parachute.
As one would imagine, this component will allow the payload to float more safely to the ground by creating air resistance and slowing its fall speed. While this component seems simple enough, the last one is the one that requires the most specific conditions for proper operation: the balloon itself. This balloon represents essentially the entire path of the flight: what altitude the balloon will reach, what pressure the balloon will burst at, how much weight it can carry, how fast it will rise, etc. All of these factors must be taken into account when inflating the balloon, as the amount of helium it is filled with will define the values of these factors. There is one exception, however: controlled test flights. For our test run, the entire assembly described was tied to a long reel of string, allowing the altitude and path of the balloon to be directly controlled. As a result, the amount of helium needed to be added to the balloon was not specific, and we simply added whichever amount provided us with enough lift to allow the whole assembly to float.
In order to plot its location on a map in real-time, the habhub Tracker is used in most flights. We soon discovered that we were not entirely prepared for launch yet, however, as this tool required quite a bit of configuration before being able to receive our information properly. Jumping back to the Pi in the Sky website once again, the step-by-step instructions allowed us to quickly get things up and running, with the tool receiving and processing our location information in a matter of minutes. At that point, we were ready for the test launch, and we let the balloon soar high into the air. Guiding the balloon with the attached string, we lead the flight across our school’s football field and track, reeled it in, and brought it back to the starting location.
Results
Going back to the laptop, we checked to make sure the data had been properly recorded and received. After taking a quick look at the habhub Tracker, it was plain to see that we at least were able to obtain some definite data. The quality of this data, however, could not be fully analyzed until it was brought into Google Earth to visualize it in a third dimension.
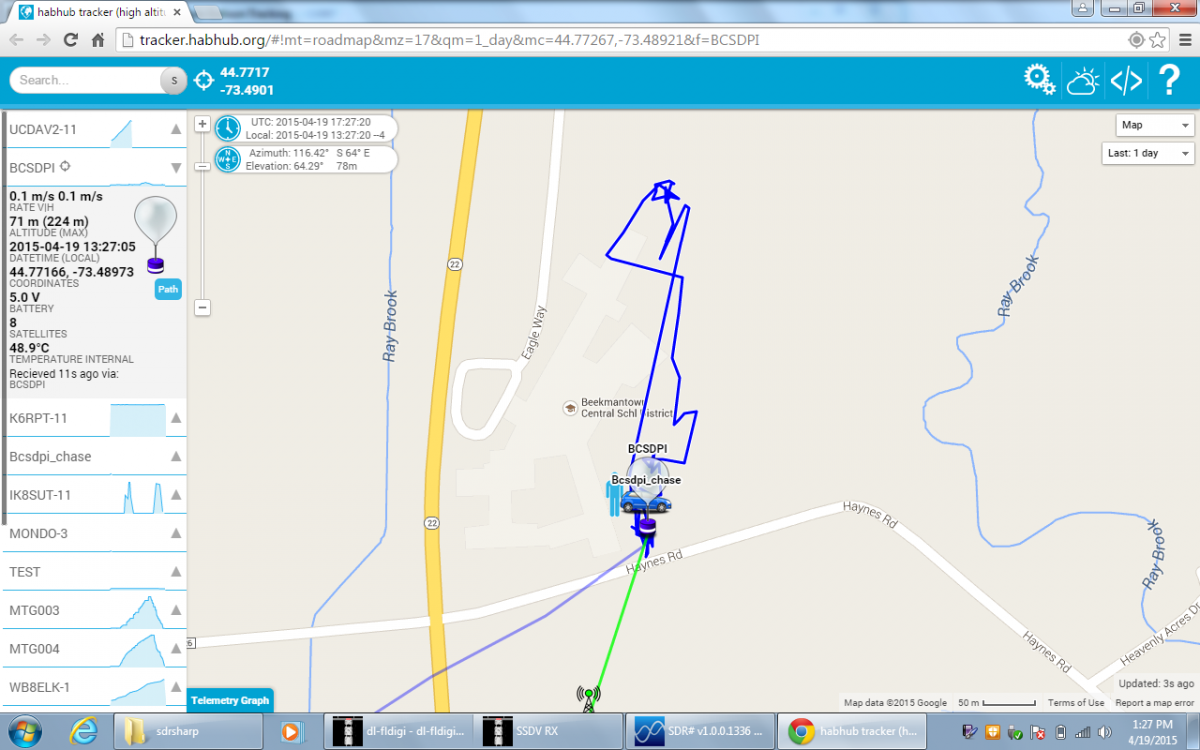
Figure 3: Flight path of the Eagle Pride in the Sky test flight.
The tracker appears to have properly plotted the location of the balloon during the flight. At this point, the only thing needed to be done was to compile all of our data into a more easily viewable format and retrieve our photographs. Luckily enough, the habhub Tracker allows for easy exporting of the flight path as a KML file, which can then be read in Google Earth to generate a better, 3D representation of where the balloon flew. After a bit of fiddling with the program, this ended up as the final result:
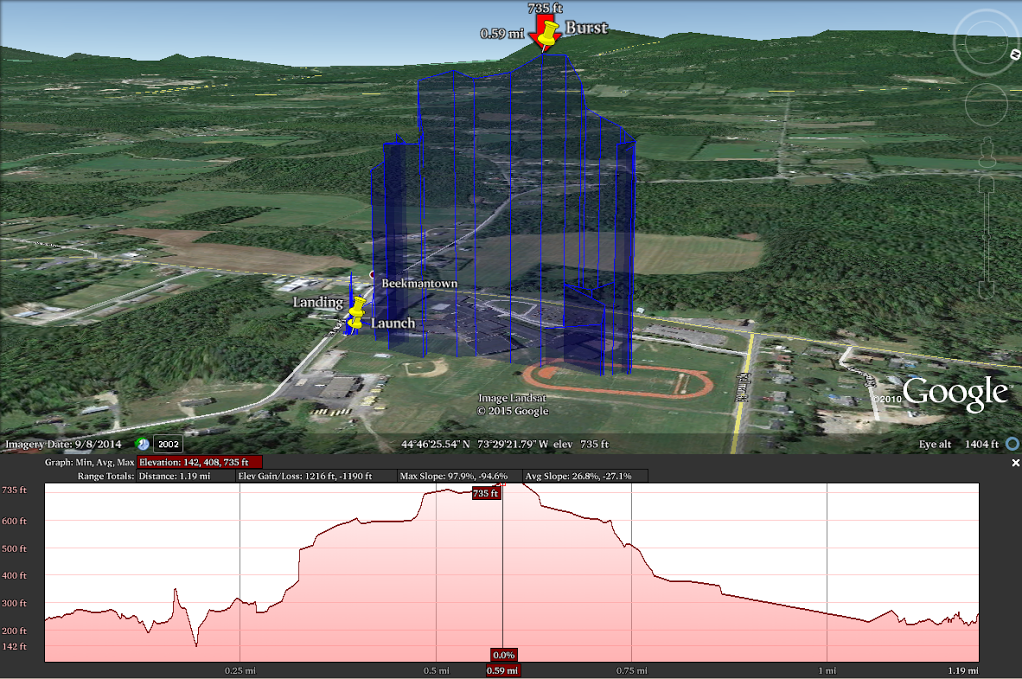
Figure 4: Three-dimensional rendering of test flight data illustrating actual path flown by the Eagle Pride in the Sky Balloon and payload (top) and elevation profile of the test flight (bottom).
Looking back at the PIE6 path used as an example earlier, the type of structure formed by our flight matches Dave’s to a T, meaning that this test was definitely a success. On top of this, the path created by the tracker generally matches what was observed during the flight, despite some minor errors which will be addressed later. The only thing left at this point was the photographs. After a bit of searching around the SD card’s file system, we finally retrieved what we had most sought going into this project:
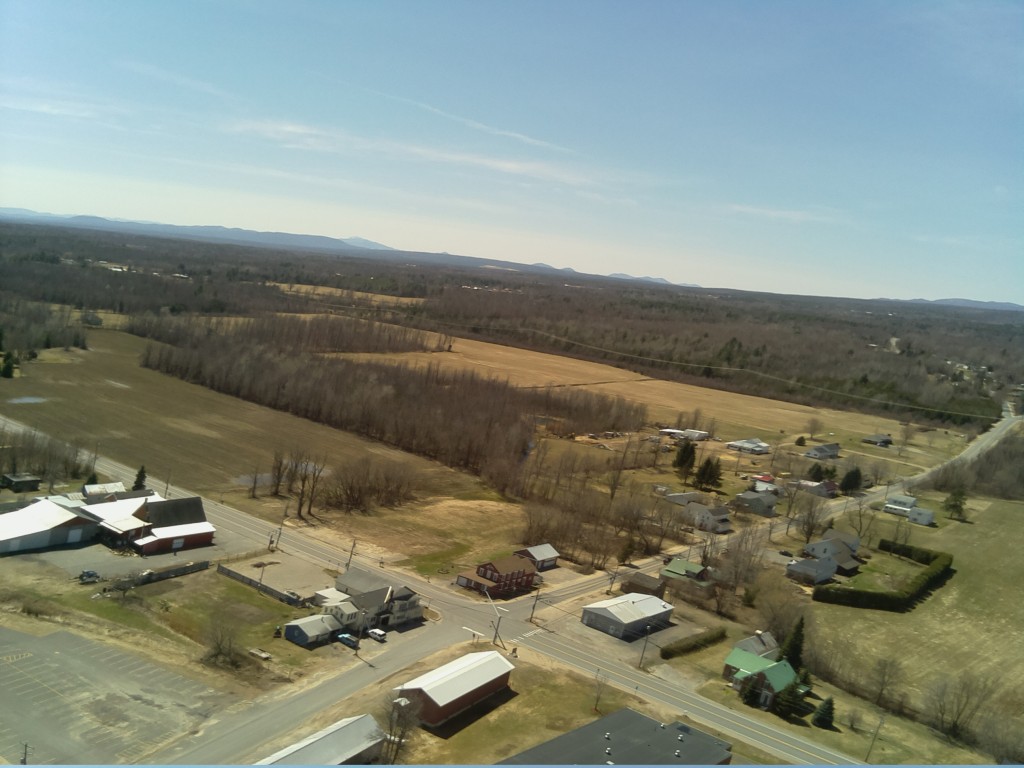
Figure 5: Actual photograph taken from the Eagle Pride in the sky of the four corners in Beekmantown, New York.
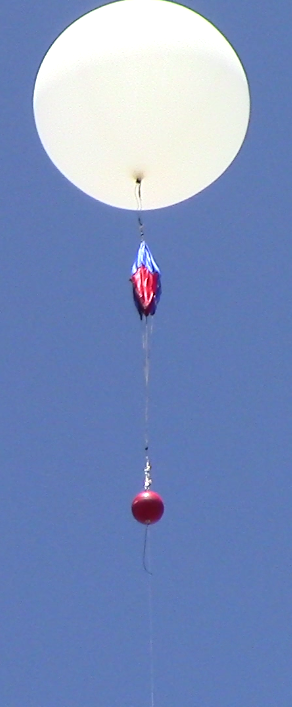
Figure 6: Complete Eagle Pride in the Sky weather balloon and payload in flight.
Discussion
Although our test was most definitely a success, a number of errors and afterthoughts arose once the data was fully analyzed. For starters, an odd “jittering” effect on the location map was noticed when the payload’s location stayed within a small area.
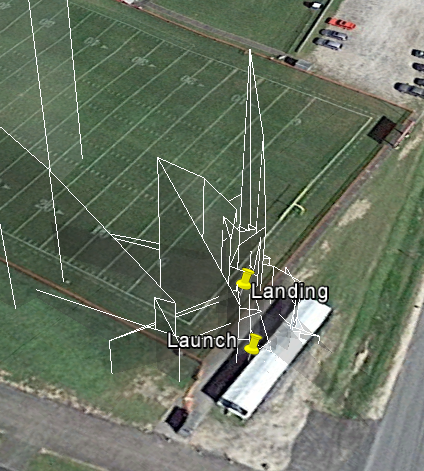
Figure 7: Initial skewed data flight path indicating anomalies in reception.
This data serves no real purpose in terms of the actual flight, as this was simply from when the payload was kept in place while waiting to launch the flight. However, it should be noted that, while the payload was kept in place, multiple, and quite frankly strange locations were reported during this time, including part way across the football field, up in the air, and even 100ft underground. As a result, it can be assumed that, with any GPS reception in general, there will always be some degree of error in the reporting of location, be that large or small. Over a larger area of data collection, this entropy will have little impact on the results because of the sheer scale of the path, but it should be observed that it still exists.
Although that error is for the most part minor, our reception of the radio signal from the Pi will most definitely need to be improved. Around halfway across the school’s running track, the location of the payload stopped being recorded altogether, even though we moved all the way out to the road adjacent to it. Because of the somewhat poor reception observed during one of the earlier tests, it can be hypothesized that the distance between the balloon and the laptop grew too great, causing no data to be received. Once the balloon was pulled closer to the ground, the signal strength seemed to decrease even further. Between the area at which the balloon was lowered and its return to the station, it was noticed that there was a great lack of location points. This absence can most likely also be attributed to the poor reception, for as the balloon grew closer to the ground, more objects were within the path of radio transmission.
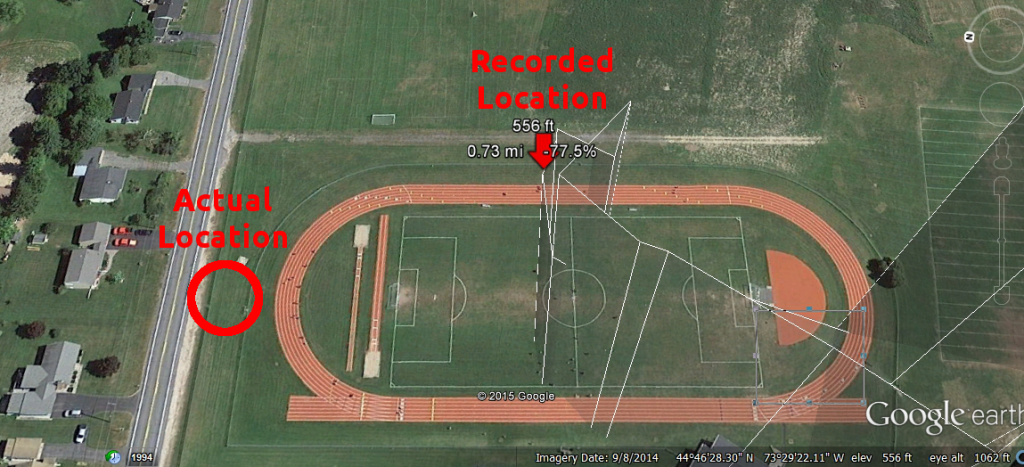
Figure 7: Secondary skewed data flight path indicating anomalies in reception at end of test flight.
Before running this test, it was noted that factors like wire diameter and the overall size of the Yagi antenna could have a drastic impact on obtain good reception. When developing a new version of the antenna for a future flight, these elements will most definitely be taken into account.
In our main test, the entire balloon assembly was guided and controlled using a string, like a kite. In a real flight, however, the movement of this balloon will be the decision of the launch day’s weather conditions; specifically speaking, the wind will decide where the balloon moves. This concept had already been understood in the past, and will definitely be put into practice in the future. Many online resources and tools are available to predict the path of the balloon based on the day’s weather conditions, although these should be taken as references only, and not definite paths. The habhub predictor will most likely be the tool that will be used in this task, as habhub.org’s suite of online tools seems to definitely be one that is respected, treasured, and frequently used by the weather ballooning community.
Although not as large, a technical difficulty we did encounter when setting up the Pi was that, when leaving the unit on for extended periods of time, the Pi will continue to take and save photos, like expected. The negative side effect of this, however, is that the Pi is able to fill up its own SD card to the point where it is unable to save any information, period. As one would expect, this would be quite the predicament if the balloon was already aloft, so it is definitely of high importance to clear the SD card’s photos before starting anything.
Conclusions
As a whole, the test flight went exactly as expected, producing the location and GPS data which we sought after and required to reach a sound conclusion to our experiment. Error discussed previously, the most important of which being path predictions and signal strength, will most definitely need to be resolved before the main flight will be launched. Over the course of this project, however, several key applications were noticed which could have practical uses in the real world.
While searching for good examples of flights on Dave Akerman’s website, I had noticed a number of commercial and educational flights launched by him. Some programs which involved these flights include BBC Stargazing, Wreck My Dress, and BBC Cracking the Code. These programs allow the ballooning community to reach out to people who might otherwise not know about the possibility of this stunt, with onlookers ranging anywhere from average TV watchers to students looking to learn something about this field.
Many fields of science also played a role in the educational aspect of this project, and anyone wishing to learn more about these areas or apply their own knowledge will be glad to hear they will definitely be satisfied. For one, the study of global winds is crucial to predicting the path of flight the balloon will take, as different areas of the world have certain currents in the atmosphere which define the general path of anything within them. For example, by observation of the earth.nullschool.net website, launching the balloon in upstate New York would most likely bring it to a location north-east of where it was launched. Launching it at the other end of the state in New York City would cause the balloon to drift south-east out to sea. In the UK, where global winds appear to be weaker, there wouldn’t be a whole lot of drift at all. These widely differing possibilities illustrate the importance of not making any assumptions in the balloon’s trajectory when launching and to do proper research in this area.
On the technology side of the scientific spectrum, however, there’s also the study of how physics can be used in the radio aspect of this project. The topic of waves plays a crucial role in understanding the inner workings of operating and developing an antenna, especially on the measurement side of things. For example, when looking into the development of an early prototype antenna, we needed to calculate a ¼ of the wavelength of a 434mhz radio wave. In physics, this can be found using the formula v/f = λ, where v represents the speed at which the wave is traveling (3.0*10^8 m/s in this case, which is the speed of light), f represents the frequency in hertz (434mhz = 434000000hz), and λ, pronounced “lambda”, represents the length of one full wave in meters. Going through the math, λ ends up being about 1.447m, with ¼ of that value being about 0.362m.
Had we planned on running this experiment on a larger scale, there would also be a much wider range of data able to be analyzed, much of which could play a huge role in meteorological research. Variables such as temperature, pressure, video, and forces applied could all be recorded and analyzed in order to try and find any connection between them, such as how the temperature and pressure changed as altitude rose. This study of variable relation, for anyone extremely interested in the inner workings of weather predications, could use these trends to help make their future predictions more accurate by having a greater understanding of these workings.
Acknowledgements
Dave Akerman’s flights and add-on board were instrumental in leading us in the right direction, both example-wise and in providing the proper equipment and software to execute this project. The UKHAS wiki also was a great help, providing great tutorials and informational resources which also helped lead the project in the right direction. As said before, the QuickYagi software was also extremely useful, providing us with the information necessary to design a proper antenna. The habhub.org suite of tools also played a crucial role in the project, helping us to automate the process of data collection and analysis though it’s Google Earth/Google Maps graphing system, as well as to predict the path of flight for the final run.
References/Bibliography
Beccario, C. (n.d.). Earth :: A global map of wind, weather, and ocean conditions. Retrieved April 24, 2015.
Habhub tracker (high altitude balloons). (n.d.). Retrieved April 24, 2015.
CUSF Landing Predictor 2.5. (n.d.). Retrieved April 24, 2015, from http://predict.habhub.org/
Akerman, D. (2015, April 17). Pi in the Sky – Rasperrry Pi Telemetry Board. Retrieved April 24, 2015.
UKHAS Wiki. (2015, March 19). Retrieved April 24, 2015.
Akerman, D. (2015, April 11). Dave Akerman. Retrieved April 24, 2015.
QUICK YAGI QY4 ANTENNA DESIGN PROGRAM by WA7RAI. (n.d.). Retrieved April 24, 2015.
